Appearance
Canvas
Canvas is a new component introduced in HTML5 that acts like a blank slate on which you can draw various charts, animations, and more using JavaScript.
Before Canvas, drawing was primarily done using Flash plugins, requiring interactions between JavaScript and Flash. With Canvas, we can achieve drawing directly with JavaScript, eliminating the need for Flash.
A Canvas defines a rectangular area of specified dimensions, within which you can freely draw:
html
<canvas id="test-canvas" width="300" height="200"></canvas>Due to inconsistent support for HTML5 standards across browsers, it’s common to include fallback HTML inside the <canvas> element. If the browser supports Canvas, it will ignore the inner HTML; if not, it will display the fallback content:
html
<canvas id="test-canvas" width="200" height="100">
    <p>Your browser does not support Canvas</p>
</canvas>
To check if the browser supports Canvas, you can use canvas.getContext:
javascript
let canvas = document.getElementById('test-canvas');
if (canvas.getContext) {
    console.log('Your browser supports Canvas!');
} else {
    console.log('Your browser does not support Canvas!');
}
The getContext('2d') method allows us to obtain a CanvasRenderingContext2D object, which is essential for all drawing operations:
javascript
let ctx = canvas.getContext('2d');For 3D drawing, HTML5 also includes a WebGL specification, allowing 3D graphics within Canvas:
javascript
gl = canvas.getContext("webgl");In this section, we will focus on 2D graphics.
Drawing Shapes
You can draw various shapes on a Canvas. Before doing so, it’s important to understand the Canvas coordinate system:
 0,0                20
  ┌───────────────────────▶ x
  │                 │
  │
  │                 │
10│─ ─ ─ ─ ─ ─ ─ ─ ─●
  │                  20,10
  ▼
  y
The coordinate system starts at the top-left corner (0,0), with the x-axis extending horizontally to the right and the y-axis extending vertically downwards, using pixels as units, so all coordinates are non-negative integers.
The CanvasRenderingContext2D object includes several methods for drawing shapes:
javascript
let canvas = document.getElementById('test-shape-canvas'),
    ctx = canvas.getContext('2d');

ctx.clearRect(0, 0, 200, 200); // Clear a rectangle at (0,0) with size 200x200
ctx.fillStyle = '#dddddd'; // Set fill color
ctx.fillRect(10, 10, 130, 130); // Fill a rectangle at (10,10) with size 130x130

// Draw complex paths using Path2D:
let path = new Path2D();
path.arc(75, 75, 50, 0, Math.PI * 2, true);
path.moveTo(110, 75);
path.arc(75, 75, 35, 0, Math.PI, false);
path.moveTo(65, 65);
path.arc(60, 65, 5, 0, Math.PI * 2, true);
path.moveTo(95, 65);
path.arc(90, 65, 5, 0, Math.PI * 2, true);
ctx.strokeStyle = '#0000ff';
ctx.stroke(path);
Drawing Text
You can also draw text at specified positions, setting font, style, shadow, etc., similar to CSS:
javascript
let canvas = document.getElementById('test-text-canvas'),
    ctx = canvas.getContext('2d');

ctx.fillStyle = '#fff';
ctx.fillRect(0, 0, 300, 100);
ctx.shadowOffsetX = 2;
ctx.shadowOffsetY = 2;
ctx.shadowBlur = 2;
ctx.shadowColor = '#ccc';
ctx.font = '28px Arial';
ctx.fillStyle = '#999';
ctx.fillText('Text with Shadow', 20, 40);
Advanced Features
Canvas can handle more than just basic shapes and text; it can implement animations, scaling, various filters, and pixel transformations. For complex operations, consider the following optimization strategies:
- Create an invisible Canvas for drawing, then copy the final result to a visible Canvas.
- Use integer coordinates rather than floating-point values whenever possible.
- Utilize multiple overlapping Canvases to draw different layers instead of complicating a single Canvas.
- For static background images, use the
<img>tag and place it at the bottom layer.
Practice
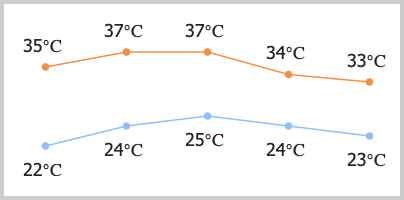
Using the weather API's JSON data, draw a future weather forecast on the Canvas, as shown in the example below: 
javascript
let data = [
    { high: 35, low: 22 },
    { high: 37, low: 24 },
    { high: 37, low: 25 },
    { high: 34, low: 24 },
    { high: 33, low: 23 }
];

let canvas = document.getElementById('weather-canvas');
// TODO: Draw the weather forecast on the canvas (400x200)

// Download link:
let download = document.getElementById('weather-download');
download.href = canvas.toDataURL();